How Russian trolls manipulated Twitter users in 2016
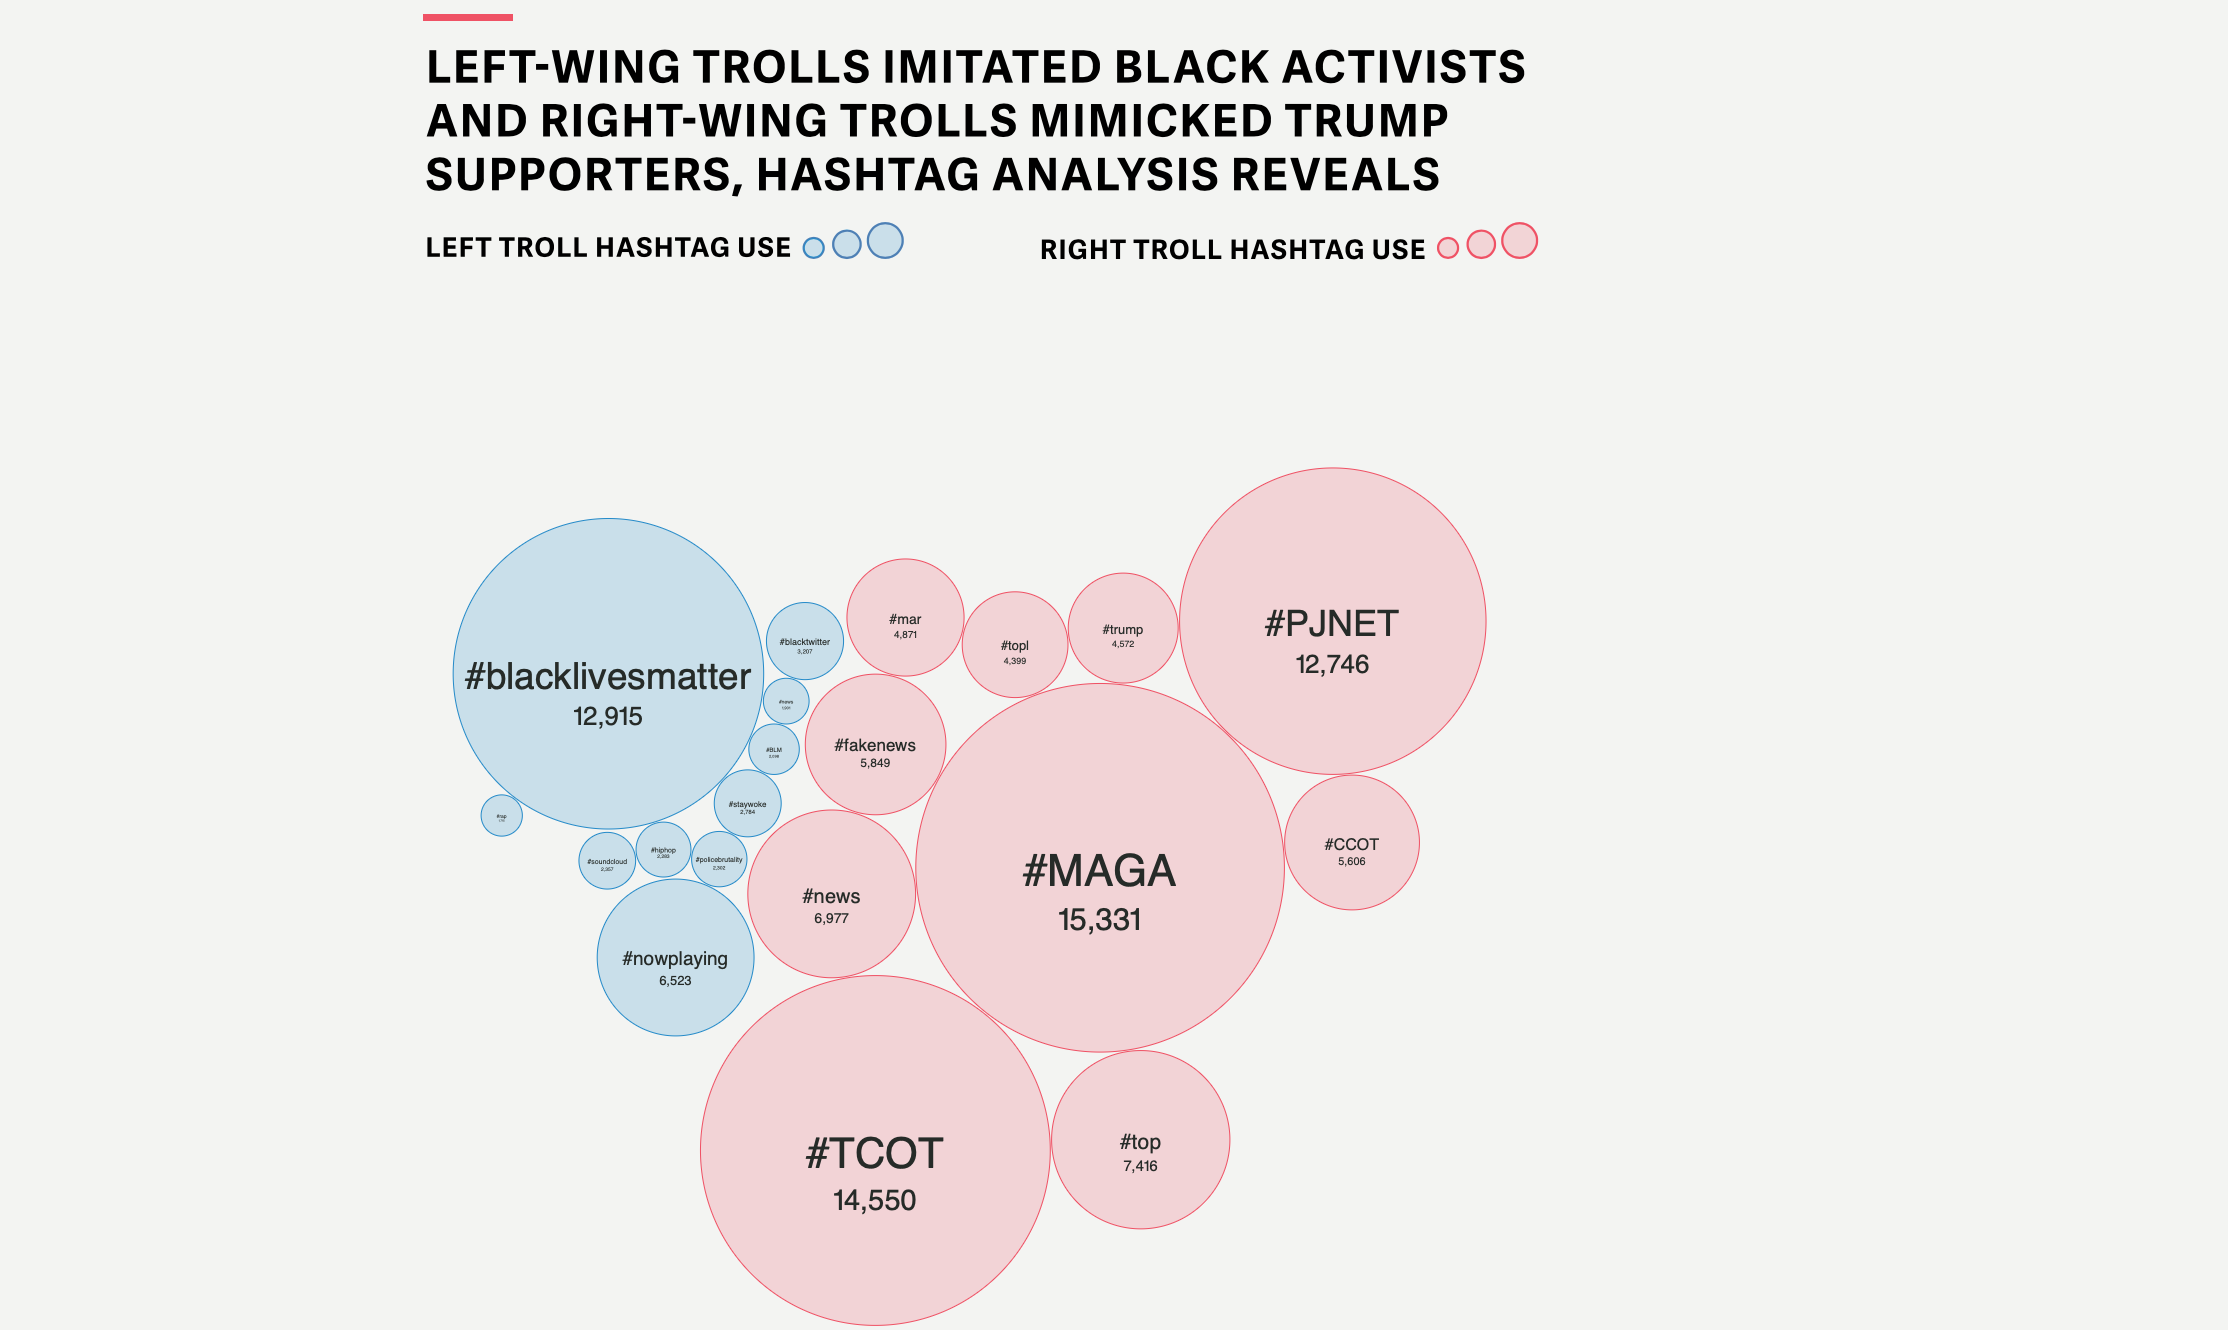
How I made this: Performed semantic analysis in R Studio on dataset provided by researchers at Clemson University. Visualization built with D3.
Developed additional interactive to test readers’ ability to spot tweets from Russian disinformation agents with Svelte.
Find the bubble chart here and the Svelte app here, or read the full story here.